In today’s fast-paced, cloud-native world, monitoring and alerting are critical for maintaining the health and performance of applications. Prometheus has emerged as a powerful, open-source solution that simplifies monitoring and alerting for modern, dynamic environments. Whether you’re running microservices, Kubernetes clusters, or traditional infrastructure, Prometheus offers a robust toolkit to keep your systems running smoothly.
In this blog post, we’ll dive deep into what makes Prometheus a go-to choice for monitoring, its key features, and how it stacks up against other popular monitoring tools.
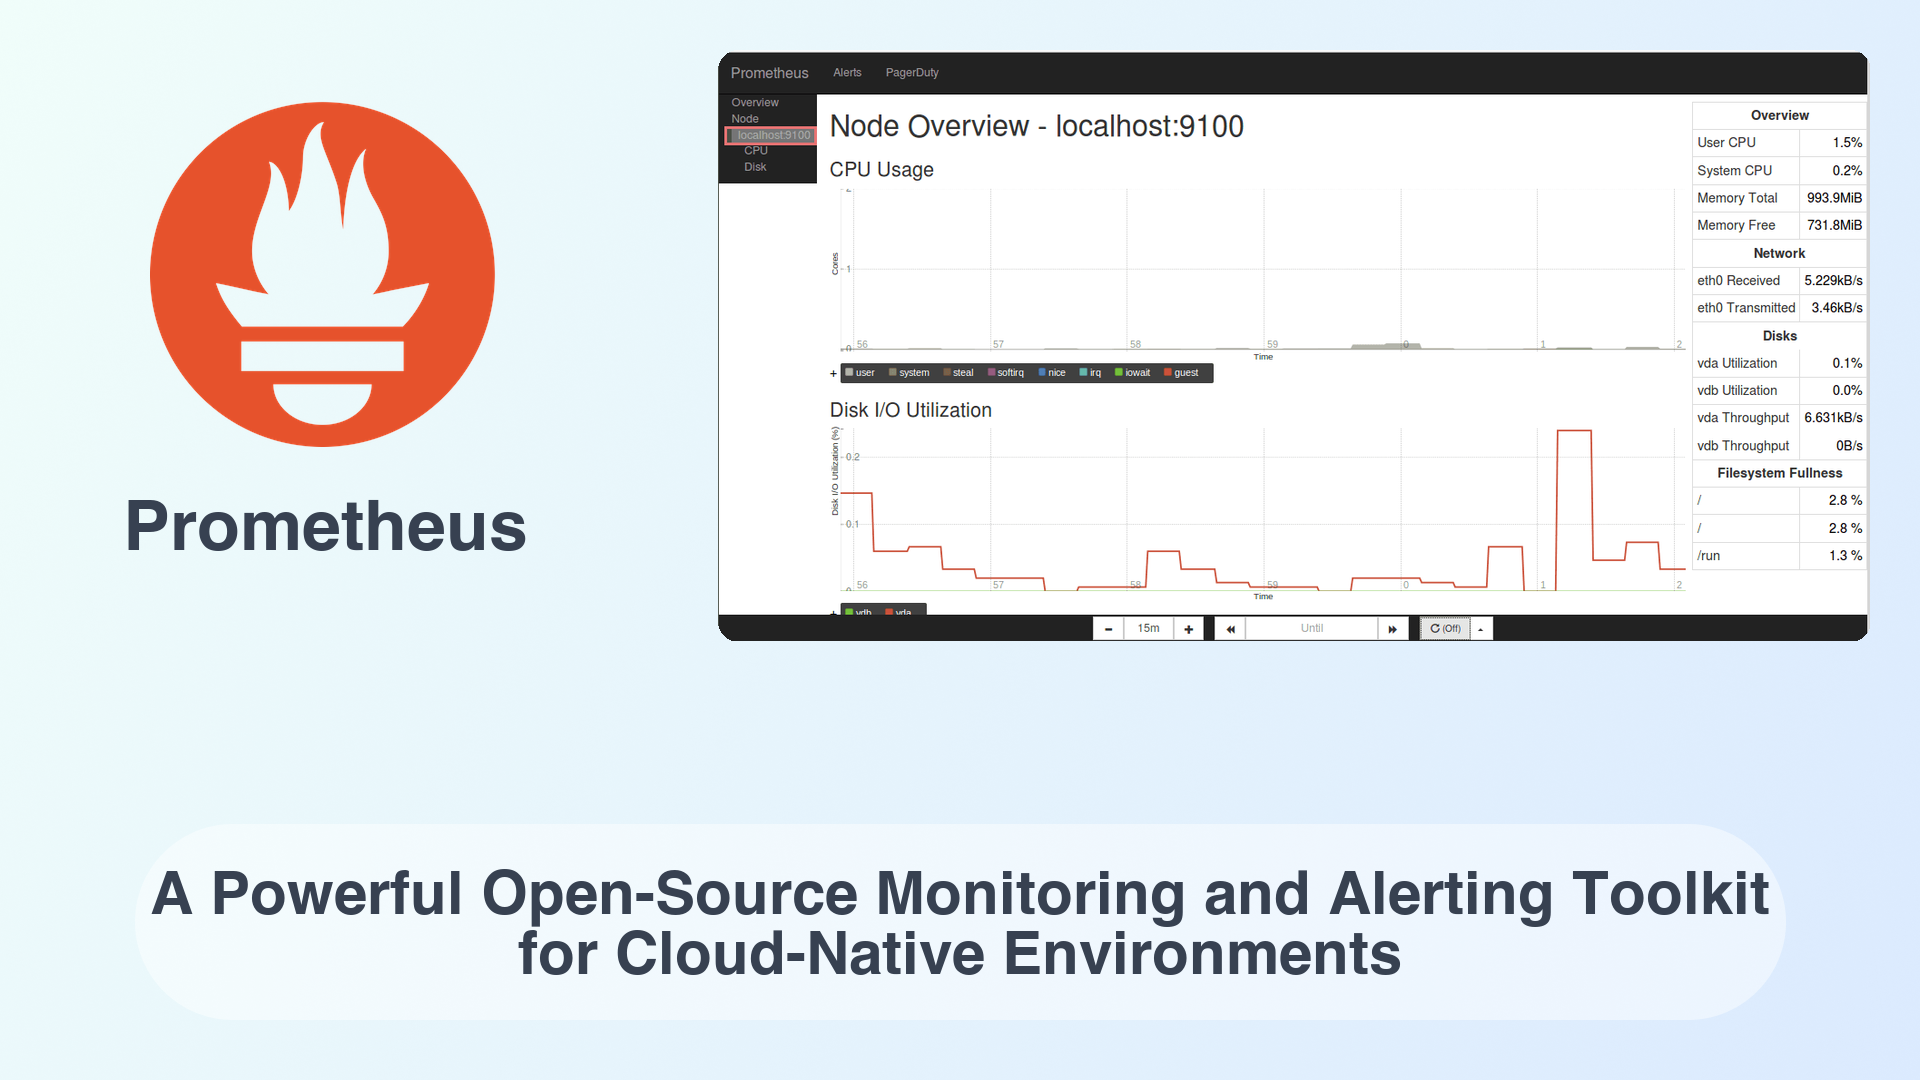
What is Prometheus?
Prometheus is an open-source systems monitoring and alerting toolkit originally built at SoundCloud. Since its inception, it has gained widespread adoption and is now a graduated project under the Cloud Native Computing Foundation (CNCF). Prometheus is designed to collect and store metrics as time-series data, enabling users to query and visualize this data in real-time.
Key Features of Prometheus
-
Multi-Dimensional Data Model:
Prometheus uses a flexible data model with key-value pairs for identifying time-series data, making it easy to filter and aggregate metrics. -
Powerful Query Language (PromQL):
PromQL allows users to slice and dice metrics, create custom alerts, and generate insightful visualizations. -
Efficient Storage:
Prometheus stores time-series data in a highly efficient format, ensuring scalability even for large-scale environments. -
Pull-Based Architecture:
Unlike traditional push-based systems, Prometheus pulls metrics from targets, making it easier to manage and scale. -
Alerting and Notification:
Prometheus comes with a built-in alerting mechanism that integrates seamlessly with tools like Alertmanager to send notifications via email, Slack, PagerDuty, and more. -
Integration with Kubernetes:
Prometheus is a natural fit for Kubernetes environments, offering out-of-the-box support for monitoring containerized applications. -
Extensive Ecosystem:
With a rich set of exporters and integrations, Prometheus can monitor everything from databases to web servers.
Why Choose Prometheus?
Prometheus is particularly well-suited for cloud-native environments due to its ability to handle dynamic, ephemeral workloads. Here are some reasons why it stands out:
- Scalability: Prometheus can handle millions of time-series metrics, making it ideal for large-scale deployments.
- Flexibility: Its multi-dimensional data model and PromQL allow for highly customizable monitoring and alerting.
- Community Support: As a CNCF project, Prometheus benefits from a vibrant community and continuous development.
- Cost-Effective: Being open-source, Prometheus eliminates the need for expensive proprietary monitoring solutions.
Prometheus vs Other Monitoring Tools
To help you understand how Prometheus compares to other monitoring tools, here’s a quick comparison table:
| Feature/Tool | Prometheus | Grafana | Nagios | Zabbix |
|---|---|---|---|---|
| Architecture | Pull-based | Visualization-focused | Push-based | Hybrid (Push/Pull) |
| Data Model | Multi-dimensional | N/A (Visualization only) | Flat | Multi-dimensional |
| Alerting | Built-in | Requires integration | Built-in | Built-in |
| Kubernetes Support | Native | Requires integration | Limited | Requires integration |
| Ease of Use | Moderate | Easy | Complex | Moderate |
| Scalability | High | High | Moderate | High |
| Cost | Free (Open Source) | Free/Paid Plans | Free/Paid Plans | Free/Paid Plans |
How OctaByte Can Help with Prometheus
At OctaByte, we specialize in providing fully managed services for open-source software like Prometheus. Here’s how we can help:
- Seamless Deployment: We handle the installation and configuration of Prometheus, ensuring it’s tailored to your environment.
- Ongoing Management: From backups to server management, we take care of all the technical details so you can focus on your business.
- Custom Alerts and Dashboards: We set up custom alerts and dashboards to meet your specific monitoring needs.
- 24/7 Support: Our team is always available to assist with any issues or optimizations.
Conclusion
Prometheus is a game-changer in the world of monitoring and alerting, especially for cloud-native environments. Its powerful features, scalability, and flexibility make it a top choice for organizations of all sizes. Whether you’re just starting with monitoring or looking to upgrade your existing setup, Prometheus is worth considering.
At OctaByte, we make it easy to adopt and manage Prometheus, so you can focus on what matters most—building and scaling your applications. Ready to get started? Contact us today to learn more about our managed Prometheus services.
Call to Action:
Explore our managed Prometheus services at OctaByte and take the first step toward hassle-free monitoring and alerting!