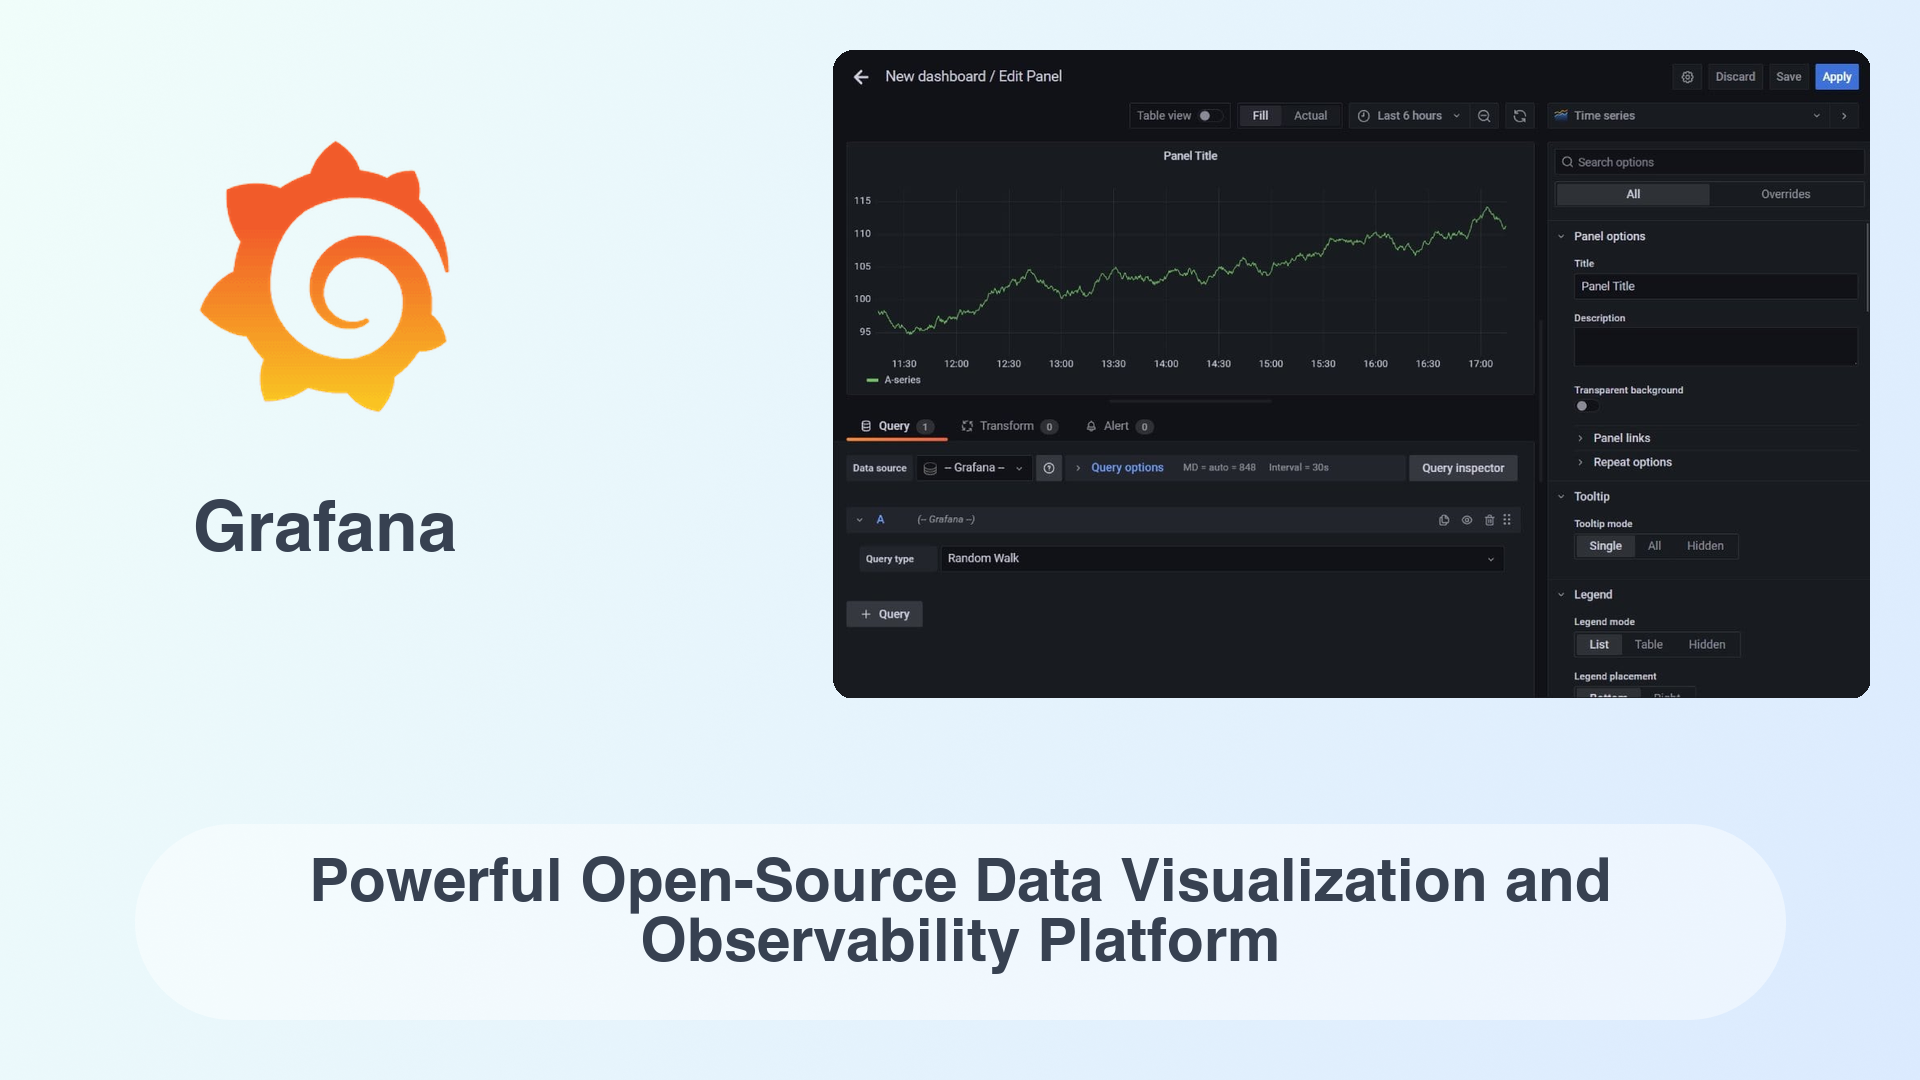
Introduction to Grafana
In today’s data-driven world, visualizing and monitoring data is crucial for businesses to make informed decisions. Grafana is a leading open-source platform that empowers organizations to create, explore, and share data visualizations and dashboards. Whether you’re monitoring application performance, tracking server metrics, or analyzing business data, Grafana provides the tools to turn raw data into actionable insights.
At OctaByte, we specialize in deploying and managing open-source software like Grafana, ensuring that your data visualization needs are met with minimal effort on your part. Let’s dive into what makes Grafana a standout choice for data visualization and observability.
What is Grafana?
Grafana is an open-source platform designed for data visualization, monitoring, and observability. It allows users to create interactive and customizable dashboards that display data from various sources, including databases, cloud services, and monitoring tools. Grafana supports a wide range of data sources, such as Prometheus, InfluxDB, Elasticsearch, and more, making it a versatile tool for diverse use cases.
Key Features of Grafana
- Interactive Dashboards: Create visually appealing and interactive dashboards with drag-and-drop functionality.
- Multi-Data Source Support: Connect to multiple data sources simultaneously for comprehensive data analysis.
- Alerting and Notifications: Set up alerts to notify your team when metrics exceed predefined thresholds.
- Plugins and Extensions: Extend Grafana’s functionality with a rich ecosystem of plugins.
- Collaboration: Share dashboards and insights with your team or the broader community.
- Open Source: Grafana is free to use, with a strong community backing and regular updates.
Why Choose Grafana?
Grafana stands out in the crowded field of data visualization tools for several reasons:
- Flexibility: Grafana supports a wide range of data sources, making it adaptable to various industries and use cases.
- Ease of Use: Its intuitive interface allows users to create dashboards without extensive technical knowledge.
- Scalability: Grafana can handle large datasets and is suitable for both small businesses and large enterprises.
- Community Support: As an open-source tool, Grafana benefits from a vibrant community that contributes plugins, templates, and support.
Grafana vs Competitors: A Comparison
To help you understand Grafana’s unique value proposition, here’s a comparison with other popular data visualization and observability tools:
| Feature/Tool | Grafana | Kibana (Elastic) | Tableau | Power BI |
|---|---|---|---|---|
| Open Source | Yes | Yes | No | No |
| Data Source Support | 50+ (Prometheus, InfluxDB, etc.) | Elasticsearch only | Limited | Limited |
| Custom Dashboards | Highly customizable | Customizable | Customizable | Customizable |
| Alerting | Built-in | Requires X-Pack | Limited | Limited |
| Ease of Use | User-friendly | Moderate | Moderate | User-friendly |
| Cost | Free (Open Source) | Free (Basic), Paid (X-Pack) | Expensive | Subscription-based |
| Community Support | Strong | Strong | Limited | Limited |
Use Cases for Grafana
Grafana is versatile and can be used in various scenarios, including:
- IT Infrastructure Monitoring: Track server performance, network health, and application metrics.
- Business Analytics: Visualize sales data, customer behavior, and operational KPIs.
- IoT Data Visualization: Monitor and analyze data from IoT devices in real-time.
- DevOps Observability: Gain insights into application performance and system health.
How OctaByte Can Help You with Grafana
At OctaByte, we understand that setting up and managing Grafana can be time-consuming and complex. That’s why we offer fully managed Grafana services as part of our subscription plans. Here’s what we provide:
- Installation and Configuration: We handle the setup and configuration of Grafana on your preferred VM.
- Server Management: Our team ensures your Grafana instance runs smoothly with regular updates and maintenance.
- Backup and Security: We implement robust backup and security measures to protect your data.
- Custom Dashboards: We help you create tailored dashboards to meet your specific needs.
With OctaByte, you can focus on deriving insights from your data while we take care of the technical details.
Conclusion
Grafana is a powerful, open-source platform that simplifies data visualization and observability. Its flexibility, ease of use, and extensive feature set make it a top choice for businesses of all sizes. Whether you’re monitoring IT infrastructure, analyzing business data, or visualizing IoT metrics, Grafana has you covered.
Ready to harness the power of Grafana? Let OctaByte handle the technical complexities while you focus on what matters most—your data. Explore our subscription plans today and get started with a fully managed Grafana solution.
Call to Action:
Visit OctaByte to learn more about our managed Grafana services and other open-source solutions. Let us help you unlock the full potential of your data!